

Description
Buck M500/M530 Compatible | Ease of Use | Free Support
Email sales@bucksci.com for detail
Download "Scan-n-Search" IR Software for 30 Day Free Trial
Scan-n-Search Overview:
- A complete program for handling Infrared data
- A free viewer for infrared data
- A free search program for FDM IR Reference Spectra Databases
- Very easy to use, makes complex data manipulations simple
- Powerful Batch-Processing automates repetitive tasks
- Scaleable from the teaching lab to the on-line process environment
- Extensible using the powerful open-source Python programming language
- Reads and writes data in industry-standard file formats
- Collects data directly from the M530 IR spectrophotometer
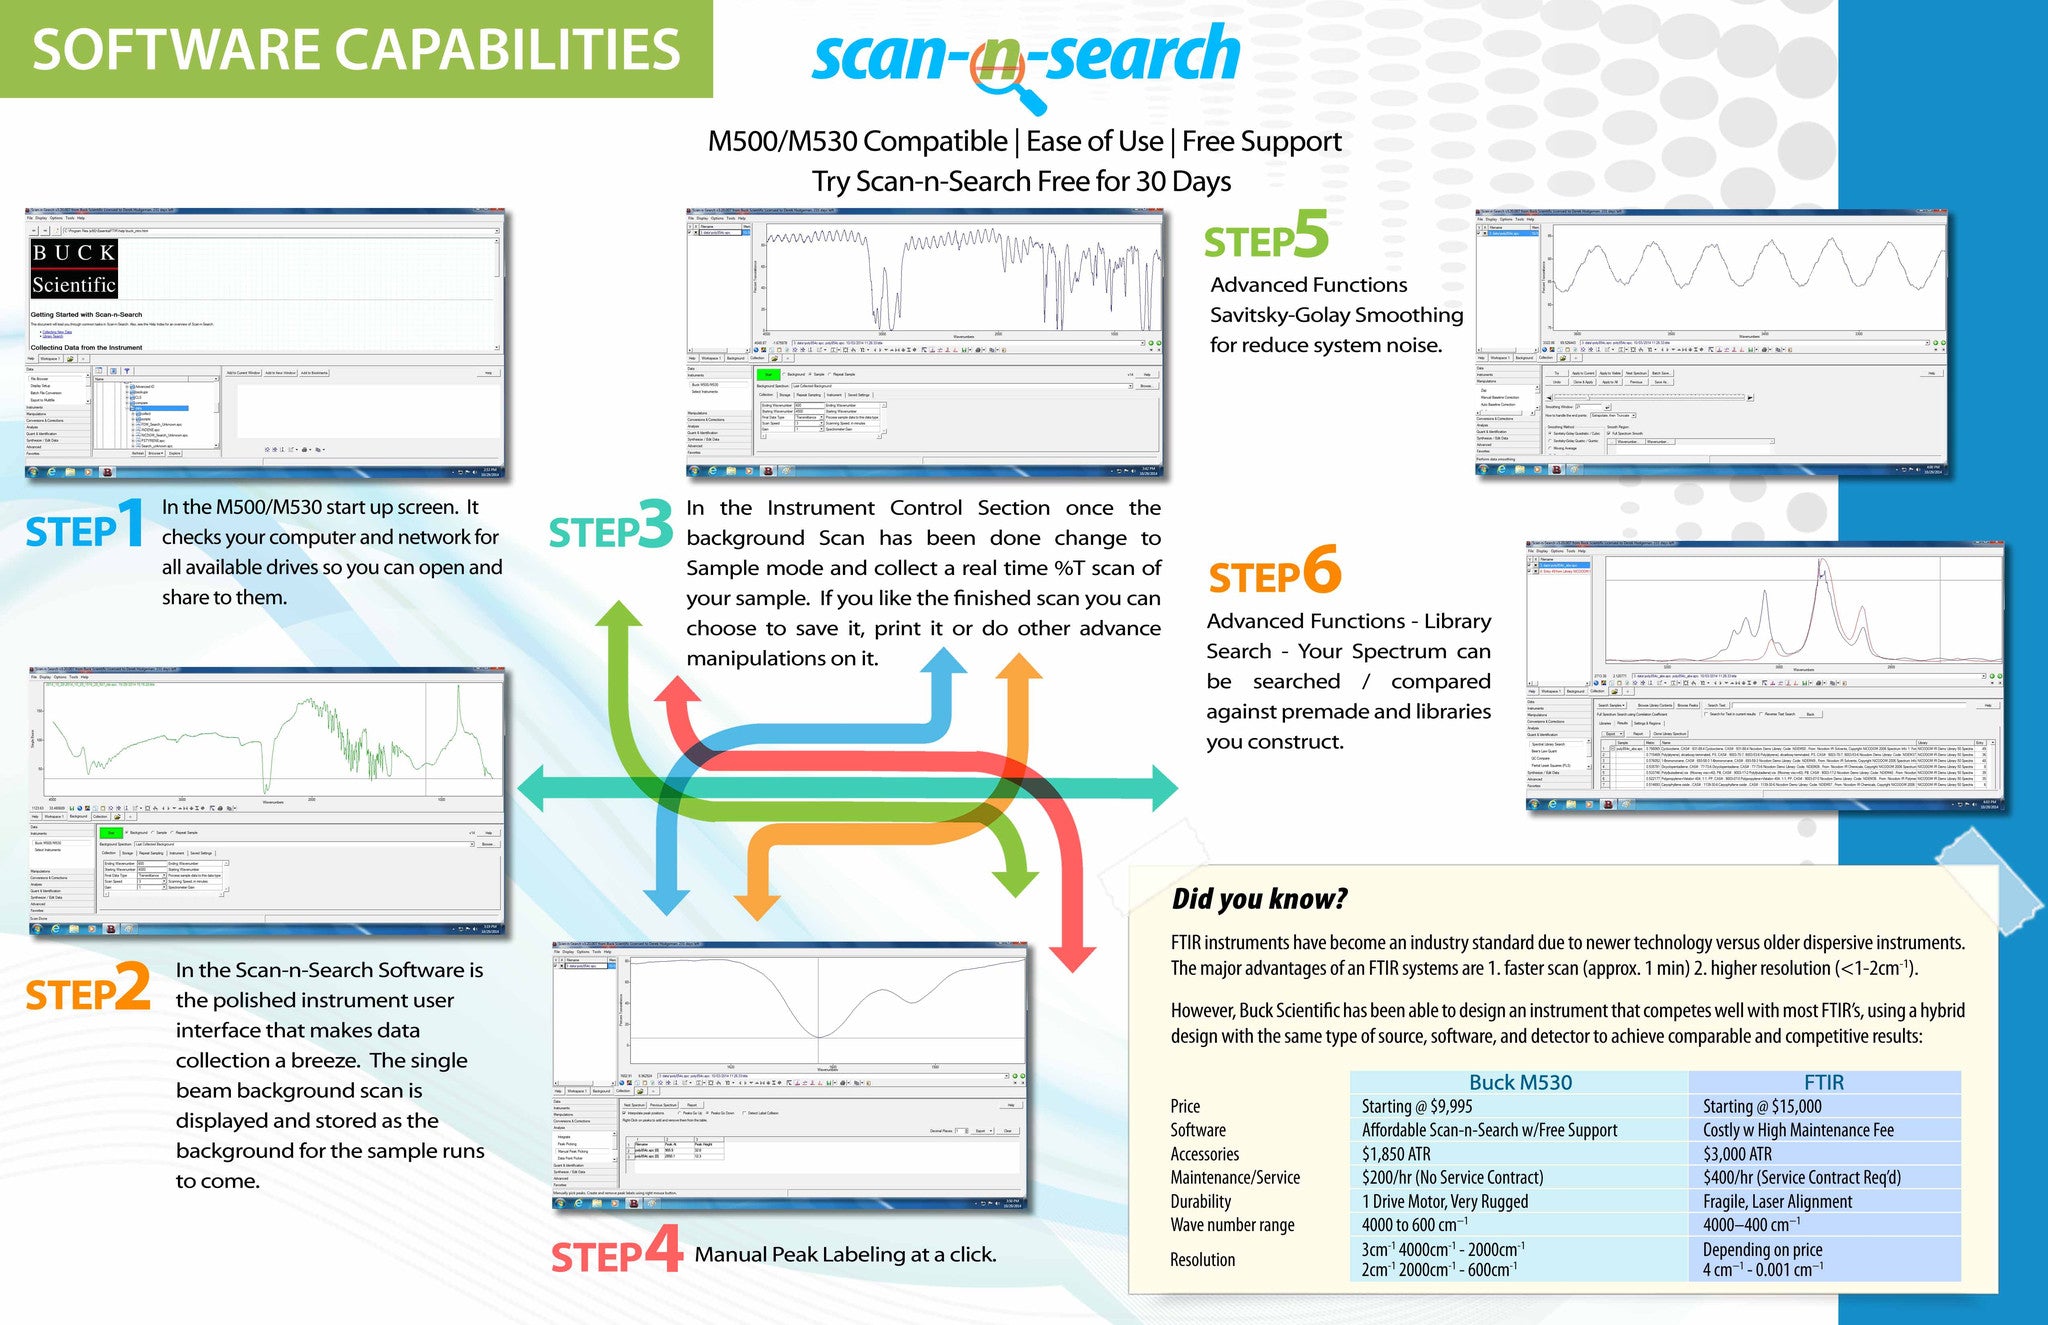
Software Capabilities:

Step 1: In the M500/M530 start up screen, it checks your computer and network for all available drives so you can open and share to them.

Step 2: In the Scan-n-Search is the polished instrument user interface that makes data collection a breeze. The single beam background scan is displayed and stored as the background for the sample runs to come.

Step 3: In the Instrument Control Section, once the background Scan has been done, change to Sample mode and collect a real time %T scan of your sample. If you like the finished scan you can choose to save it, print it or do other advance manipulations on it.

Step 4: Manual Peak Labeling at a click.

Step 5: Advanced Functions Savitsky-Golay Smoothing for reduce system noise.

Step 6: Advanced Functions - Library Search - Your Spectrum can be searched / compared against premade and libraries you construct.
IR Reference Spectra Databases
An infrared spectrum of a molecule is like a fingerprint. By comparing the spectrum of an unknown compound to a library of data, the spectroscopist can identify the unknown. This technique has wide applications in many fields such as forensics, environmental chemistry, research, industrial quality control, and teaching.
Scan-n-Search Infrared Software includes a complete spectral library search tool with user-defined region searching, many search algorithms, and customizable reports.
Commercially available Reference Spectra Databases (Libraries)
Hundreds of Thousands of reference spectra are available from:
- Fiveash Data Management. To find out more about FDM Databases and download a 14 day trial of four libraries visit www.fdmspectra.com.
- STJapan: www.stjapan-usa.com
- NICODOM: www.ir-spectra.com
When ordering STJapan or NICODOM databases, specify the format to be "Galactic - Grams/32 & SpectralID".
Scan-n-Search Infrared Software can search any database from any source that is in "Galactic - Grams/32 & SpectralID" format.
Scan-n-Search Infrared Software can search WinFIRST libraries and Sadtler User Libraries, and can search against folders of individual files.
Spectral Manipulations
- Zap Spectral Regions
- Zap spectral regions, with zeros or interpolated lines, with the capability of adding noise back into the zapped regions
- Manual Baseline Correction
- Automatic Baseline Correction
- Manual Spectral Subtraction
- X-Axis Shift and Stretch
- Take derivatives of spectral data
- FFT, ratio, absorbance, transmittance conversions
- FFT: Fast Fourier Transform of interferograms, with control over zero-filling, apodization and phase correction
- Convert data between Absorbance, Transmittance, and Diffuse Reflectance formats
- 5 to 99 point smoothing, with Savitsky-Golay, moving average, Hannig and Hamming window methods
- Interpolate / Decimate to change the resolution of the spectral data
- Manual Interactive Spectral Subtraction
- Automatic Spectral Subtraction optimized over a user-selected region
- Offset data by constant
- Scale data by constant
- Truncate to change the spectral data limits
- Kramers-Kroning transform using the Maclaurin method
- Raman Shift correction: with user supplied excitation frequency
- ATR Correction: Attenuated Total Reflectance correction with user control over angle of incidence and refractive indices
- Normalizations: Normalize the data to a minimum, a range, or using Vector Normalization
- Match spectra: set a group of spectra to have the same starting and ending values and number of data points
Synthesize Data
- Average / Add / Add with weights lists of individual datafiles to create new data
- Interactively add peaks to data by stretching data points
- Edit data: edit datapoints directly in a spreadsheet and instantly preview the result
- Create synthetic spectra from user-supplied peak tables with optional noise, baseline offset and baseline slope
- Generate Blackbody spectra with Radiance or Photon distribution for a given temperature
- Change header fields for corrupted or incorrectly converted files
Data Analysis
- Compute integrated areas of spectral regions
- Peak Picking automatically tabulates the peaks in a spectrum
- Manual Peak Picking and Labeling by right-clicking on a peak
- Peak Measurement: computes peak height using user-supplied peak endpoints
- Signal-to-Noise: computes signal-to-noise ratio over user-defined limits
- User Library Search: search unknown spectra against libraries of data.